Every week I help explain a number.
It's a score out of 1,000 that ranks fixed broadband operators on customer experience. Hundreds of physical probes sit in real homes, on real fibre lines. Around the clock, they download, upload, ping, load web pages, open social networks, stream video, play online games, even ask an LLM a question. Millions of measurements become one weekly score per operator, split across 10 services and around 36 KPIs.
That score turns into a ranking. The ranking ends up in board reports, in network decisions and, sometimes, in a marketing claim: "the best fibre experience".
Here's what makes it interesting: the gap between positions is often a few tenths of a point. Out of 1,000.
So every week the real question isn't "who won?". It's "why did each tenth move?". Was it the operator's network? A server on the other side of the internet? One broken probe in one home? One bad day?
Two stories from the last few months show why that question matters more than the score itself.
One house, one ranking
While reviewing the data, one probe stood out. Its line was provisioned as 1 Gbps. It delivered around 640 Mbps. Every test, every day, all month. In the data it looked like a customer getting 64% of what they paid for.
The automation flagged it: a probe that was always below its contracted speed. That's exactly what it's good at. It crosses hundreds of probes, every test, every day, without getting tired. But "this probe is slow" is not a diagnosis. Knowing how lines are provisioned is what turned it into one: the line was capped at roughly 640 Mbps but labelled with a 1 Gbps profile. Not a network problem. A cataloguing problem.
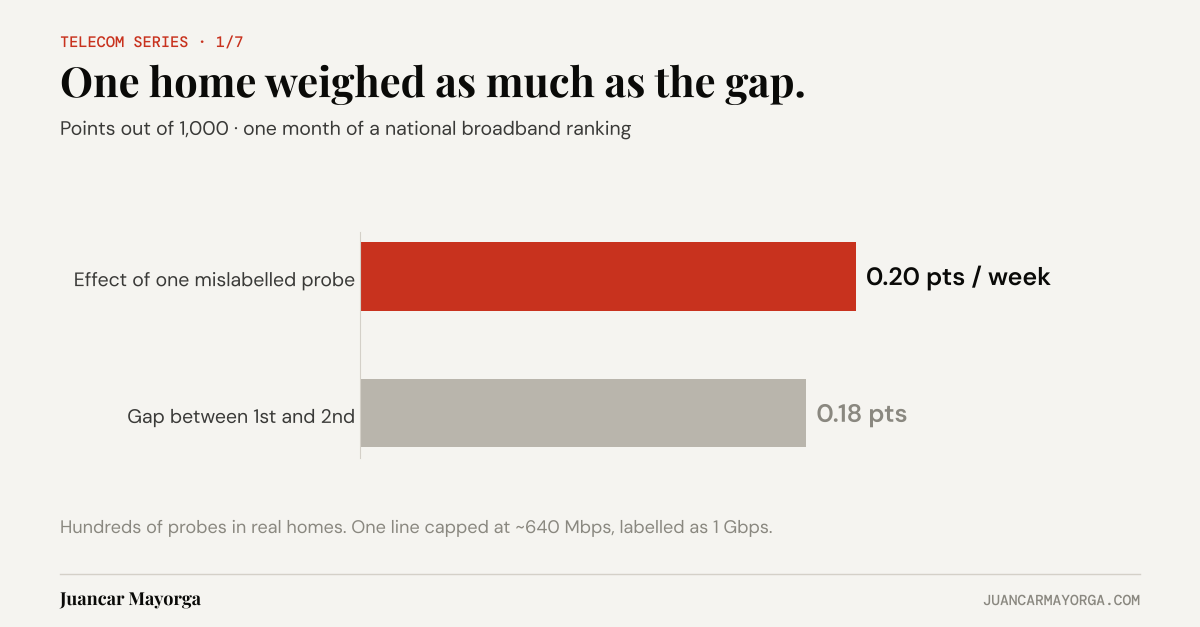
Then we measured what it was worth. Removing that probe moved the operator by about 0.20 points per week. In a ranking where positions are separated by a few tenths, that isn't noise. One home, out of hundreds, weighed about as much as the whole gap between operators.
That's the uncomfortable part. A ranking is a claim about millions of customers, built from a sample of homes. If one home can move it that much, the first question isn't who's on top. It's how reliable the number is, and whether the sample really represents the customers it speaks for: the right speed tiers, the right connection type, the right profile on every line.
And it means data cleaning is governance. Which probe is excluded, when, and why has to be recorded and reproducible. Otherwise you're not measuring networks. You're measuring whoever cleaned the data that week.
It's not your network, it's TikTok
A few weeks later, time to first byte for TikTok got worse. For one operator, that would look like a network problem. Someone would open a ticket. Someone would get a difficult phone call.
But it got worse for all six operators. At the same time.
When everyone moves together, it isn't anyone's network. It's the destination: the service, its servers, its CDN. Weeks later it went the other way. A common step of around 12 ms, on the same day, improved TikTok for everyone at once.
A useful benchmark has to separate the common cause (the destination) from the operator's own cause (its network). Without that split, the report blames whoever happens to be lowest that week. And because the margins are so small, a common movement can still reshuffle positions, simply because it hits each operator slightly differently.
Why the human still matters
None of this came from staring at dashboards. Each week there's roughly 3.5 GB of raw test data. Nobody reviews that by hand.
I work with AI as a co-developer. It writes the scripts, crosses the data exhaustively and proposes explanations. I bring the domain knowledge and make the calls. The probe story is that loop in one example: the AI found the anomaly; experience explained it. Without the first, I'd never have spotted it among hundreds of probes. Without the second, we'd have a perfectly computed, wrong conclusion ("this operator under-delivers speed") instead of the right one.
That clinical eye, knowing what looks wrong and why, is what consultants and analysts bring. AI doesn't replace it. It gives it far more to look at.
For each KPI change, we ask one question three ways: if I remove this group (a destination, a day, a set of probes) and recompute the KPI, how much of the weekly change disappears? If removing TikTok's servers makes the change vanish for every operator, it's the destination. If removing three probes makes it vanish for one operator, it's those homes. If removing one day does it, it's that day.
It's a simple test. It stops us comparing milliseconds with percentage points, and it puts a number on every explanation.
The lesson outside telecom
You don't need probes in living rooms for this to apply.
- A number is only as good as the sample behind it. Customer surveys, store panels, sales leaderboards: if one record can move the result as much as the differences you're reporting, check what your sample represents before you report who's ahead.
- Look for the common cause before blaming anyone. If every store's sales drop in the same week, it's probably not every store manager. Check what they share first: the weather, a holiday, a supplier, a system.
- Let the machine find, let the expert explain. Automation is brilliant at spotting what's odd. Deciding what it means is still a job for someone who knows the business.
The score is what everyone looks at. The work is explaining each tenth of it.
A big hug and have a great day,
Juancar Mayorga